I know this post is a bit long, but there is some new and humbling research that shows a fundamental change in the current state of wealth distribution during the 1980s. This change has led to the enrichment of top 1% by siphoning economic growth away from the poor and middle class, the consequence of which is striking in magnitude.
Full article link

Full article link
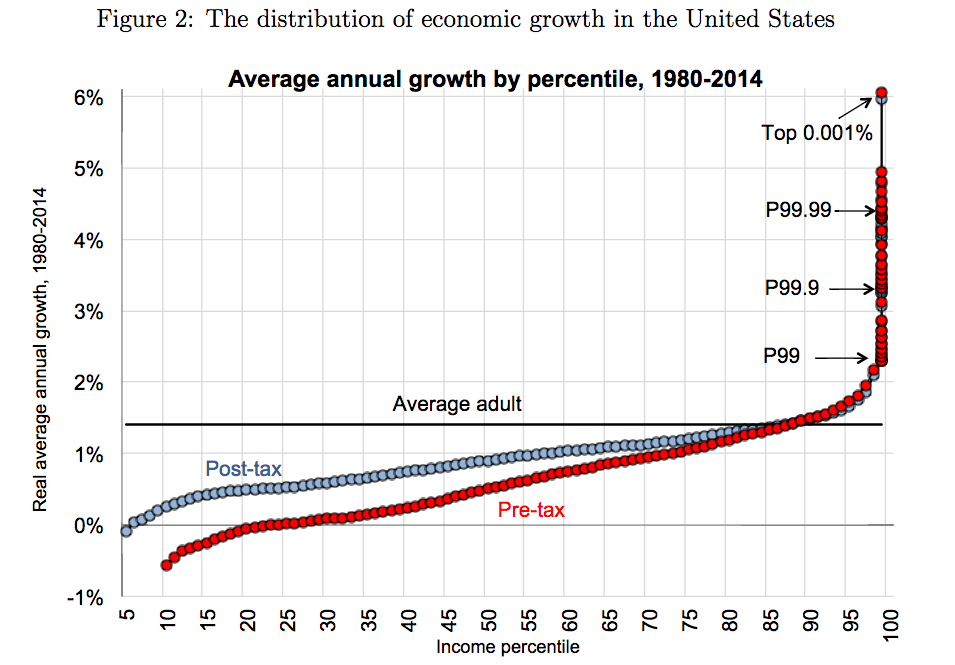
The chart above shows how much the incomes of each group grew, on average, every year from 1980 to 2014. The two lines show both pre- and post-tax incomes.
The implication is clear. People at or below the median income saw their incomes rise by 1 percent or less every year during that period. That isn’t nothing, but it’s hardly great. At the very bottom, some people have seen incomes fall pre-tax; while most poor households get government assistance to help with that, programs like food stamps or the earned income tax credit fail to reach about 20 to 25 percent of the people they’re meant to help.
But the rich? Boy, the rich made out like bandits. The top 1 percent, but really the top 0.1, top 0.01, and even top 0.001 percent (that last group included only 2,344 adults in 2014) saw really fast, dramatic growth in their incomes after 1980. Contrary to some recent commentary, the large increase in inequality isn’t due to the top 20 percent; affluent, educated professionals with low-six-figure salaries and nice homes in good suburbs aren’t driving this. Their incomes are growing about 1.5 percent a year — not bad, but not that much better than the middle class either. The major spike is in the top 1 percent (adults receiving an average of $1.31 million per year each out of national income) and above, where annual income grew by 3, 4, 5, even 6 percent.
This doesn’t appear to have been the way the economy worked from, say, 1946 to 1980. On the request of the New York Times’s David Leonhardt (who has a knack for smart suggestions for research from empirically minded economists), Piketty, Saez, and Zucman reproduced the same graph for every 34-year period from 1946 to the present. Here’s how the 1946-1980 graph compares to the 1980-2014 graph:
If the 1980-2014 graph was staggering, the 1946-1980 one is even more so. It shows that the uneven distribution of economic growth in recent decades is not the way things have always been.
In the 1950s and ’60s, poor and middle-income Americans actually saw greater income growth than rich ones. The big fat spike at the end of the chart doesn’t exist in that period. The richest of the rich got rather muted increases in income. And everyone’s income rose a great deal faster from 1946 to 1980 than the bottom 95 percent’s did from 1980 to 2014. The rich saw incomes rise more slowly then, but their incomes were still growing much faster than those of today’s middle class.
What explains this dramatic change? That part is much less well-known. But one theory, which Saez, Piketty, and Harvard economist Stefanie Stantcheva have floated, holds that very high marginal tax rates (the top rate on wages was 91 percent for most of the 1950s) discouraged the rich from making very large salaries. In particular, it prevented them from bargaining with their employers to divert money from shareholders or lower-ranked staffers into higher executive compensation.
Think of it this way. In 2017, the top federal income tax rate is 39.6 percent. So if a CEO convinces his company to raise his pay from $5 million to $6 million, he’ll get to keep $604,000 of that raise (I’m ignoring state and payroll taxes for the sake of simplicity). That’s a really healthy after-tax raise, so that CEO has a very big incentive to lobby for pay hikes like that. But in 1955, the top federal income tax rate was 91 percent. So that same pay raise would only net him $90,000. Not nothing, but a way, way smaller windfall. So back then, executives had less reason to try to fight to earn more, which kept down inequality.
Saez, Piketty, and Stantcheva argue that the main effect was to deter wage bargaining — that is, high earners used to be much less aggressive about fighting for raises. They don’t think the high tax rates actually stopped high earners from engaging in useful economic activity, or did much to harm economic growth.
Conservative and libertarian economists, naturally, disagree, and contend that rates that high have massive economic costs. The actual average tax rate that the richest Americans paid in the 1950s was only slightly higher than the average rate today (42 percent then versus 36.4 percent now); because there was less inequality, very few people were rich enough to pay the top rates, and there were many more deductions and loopholes. That also limited the amount of revenue the tax rates could raise for social programs.
But if nothing else, the Saez, Piketty, and Zucman research confirms that something really did change in the 1970s and ’80s, to make the economy less rewarding to the middle-class and poor and more rewarding to the rich. That’s an important finding, and given how careful their latest work is to include all sources of income, it’s going to be a hard one to rebut.