Income Inequality

CharminTide

Hall of Fame
Oct 23, 2005
7,319
2,032
187
I know this post is a bit long, but there is some new and humbling research that shows a fundamental change in the current state of wealth distribution during the 1980s. This change has led to the enrichment of top 1% by siphoning economic growth away from the poor and middle class, the consequence of which is striking in magnitude.

Full article link
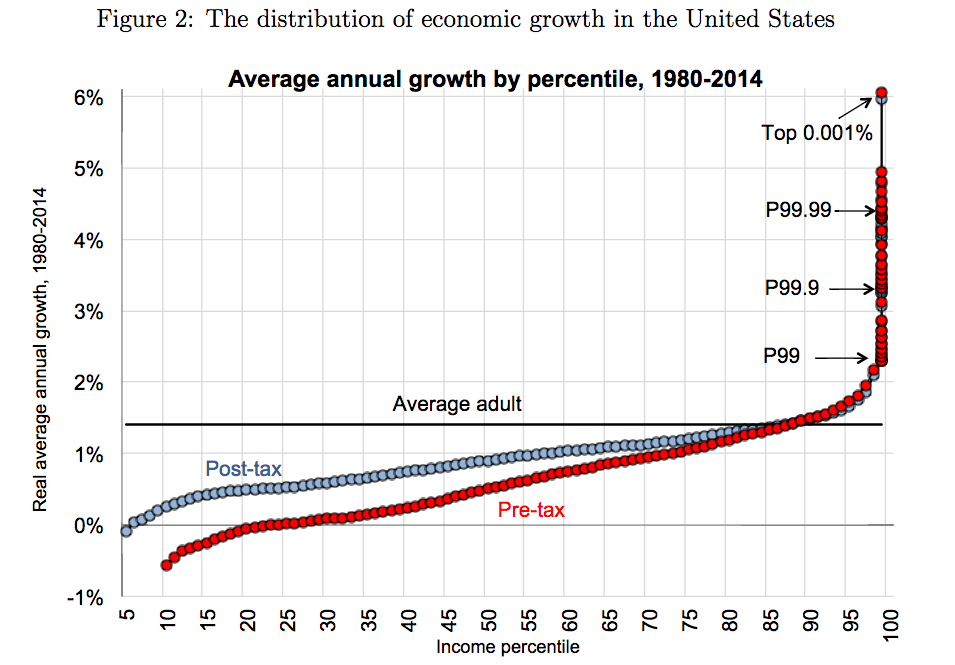


The chart above shows how much the incomes of each group grew, on average, every year from 1980 to 2014. The two lines show both pre- and post-tax incomes.

The implication is clear. People at or below the median income saw their incomes rise by 1 percent or less every year during that period. That isn’t nothing, but it’s hardly great. At the very bottom, some people have seen incomes fall pre-tax; while most poor households get government assistance to help with that, programs like food stamps or the earned income tax credit fail to reach about 20 to 25 percent of the people they’re meant to help.

But the rich? Boy, the rich made out like bandits. The top 1 percent, but really the top 0.1, top 0.01, and even top 0.001 percent (that last group included only 2,344 adults in 2014) saw really fast, dramatic growth in their incomes after 1980. Contrary to some recent commentary, the large increase in inequality isn’t due to the top 20 percent; affluent, educated professionals with low-six-figure salaries and nice homes in good suburbs aren’t driving this. Their incomes are growing about 1.5 percent a year — not bad, but not that much better than the middle class either. The major spike is in the top 1 percent (adults receiving an average of $1.31 million per year each out of national income) and above, where annual income grew by 3, 4, 5, even 6 percent.

This doesn’t appear to have been the way the economy worked from, say, 1946 to 1980. On the request of the New York Times’s David Leonhardt (who has a knack for smart suggestions for research from empirically minded economists), Piketty, Saez, and Zucman reproduced the same graph for every 34-year period from 1946 to the present. Here’s how the 1946-1980 graph compares to the 1980-2014 graph:


If the 1980-2014 graph was staggering, the 1946-1980 one is even more so. It shows that the uneven distribution of economic growth in recent decades is not the way things have always been.

In the 1950s and ’60s, poor and middle-income Americans actually saw greater income growth than rich ones. The big fat spike at the end of the chart doesn’t exist in that period. The richest of the rich got rather muted increases in income. And everyone’s income rose a great deal faster from 1946 to 1980 than the bottom 95 percent’s did from 1980 to 2014. The rich saw incomes rise more slowly then, but their incomes were still growing much faster than those of today’s middle class.

What explains this dramatic change? That part is much less well-known. But one theory, which Saez, Piketty, and Harvard economist Stefanie Stantcheva have floated, holds that very high marginal tax rates (the top rate on wages was 91 percent for most of the 1950s) discouraged the rich from making very large salaries. In particular, it prevented them from bargaining with their employers to divert money from shareholders or lower-ranked staffers into higher executive compensation.

Think of it this way. In 2017, the top federal income tax rate is 39.6 percent. So if a CEO convinces his company to raise his pay from $5 million to $6 million, he’ll get to keep $604,000 of that raise (I’m ignoring state and payroll taxes for the sake of simplicity). That’s a really healthy after-tax raise, so that CEO has a very big incentive to lobby for pay hikes like that. But in 1955, the top federal income tax rate was 91 percent. So that same pay raise would only net him $90,000. Not nothing, but a way, way smaller windfall. So back then, executives had less reason to try to fight to earn more, which kept down inequality.

Saez, Piketty, and Stantcheva argue that the main effect was to deter wage bargaining — that is, high earners used to be much less aggressive about fighting for raises. They don’t think the high tax rates actually stopped high earners from engaging in useful economic activity, or did much to harm economic growth.

Conservative and libertarian economists, naturally, disagree, and contend that rates that high have massive economic costs. The actual average tax rate that the richest Americans paid in the 1950s was only slightly higher than the average rate today (42 percent then versus 36.4 percent now); because there was less inequality, very few people were rich enough to pay the top rates, and there were many more deductions and loopholes. That also limited the amount of revenue the tax rates could raise for social programs.

But if nothing else, the Saez, Piketty, and Zucman research confirms that something really did change in the 1970s and ’80s, to make the economy less rewarding to the middle-class and poor and more rewarding to the rich. That’s an important finding, and given how careful their latest work is to include all sources of income, it’s going to be a hard one to rebut.
 

cbi1972

Hall of Fame
Nov 8, 2005
18,144
1,301
182
51
Birmingham, AL
This phenomenon has little to do with marginal US tax rates. I attribute the characteristics in this graph to the rise of globalism.
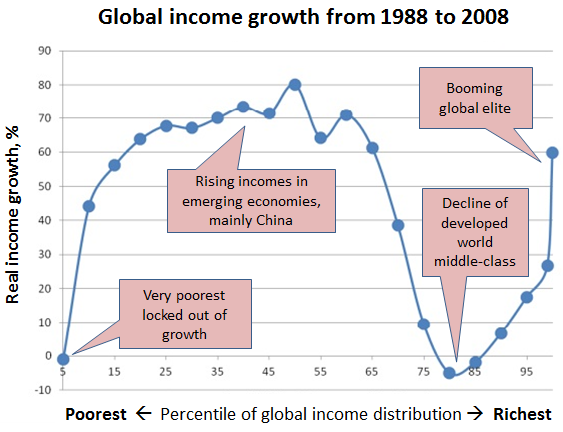
We've outsourced a lot of manufacturing, which has diverted opportunities from average Americans to average people in China, India, Malaysia, Mexico, and practically everywhere else. Foreign workers and the investor class have reaped the benefits.


The Story of Globalization in 1 Graph

The US probably represents the top 20% of the global graph. The same spike exists for the "booming global elite" but there is also a giant hump for the relatively low-income people making up the majority of the world.
 
Last edited:

bama_wayne1

All-American
Jun 15, 2007
2,700
16
57
I believe if you study industry you will find out that the productivity increase was largely brought on by increased automation and higher machine speeds. I know the article doesn't state that but having been a cost accountant for some 30 years I know that to be the case in most areas. That doesn't mean that I want the poor to be poorer just that investments in fixed assets created a lot of the gain.
 

CharminTide

Hall of Fame
Oct 23, 2005
7,319
2,032
187
This phenomenon has little to do with marginal US tax rates. I attribute the characteristics in this graph to the rise of globalism.
We've outsourced a lot of manufacturing, which has diverted opportunities from average Americans to average people in China, India, Malaysia, Mexico, and practically everywhere else. Foreign workers and the investor class have reaped the benefits.


The Story of Globalization in 1 Graph

The US probably represents the top 20% of the global graph. The same spike exists for the "booming global elite" but there is also a giant hump for the relatively low-income people making up the majority of the world.
As you state, this is global data. I presented U.S. data. And even the link you provided contrasts booming socioeconomic mobility in a few select global markets against the far below average mobility seen in the U.S.
 

CharminTide

Hall of Fame
Oct 23, 2005
7,319
2,032
187
I believe if you study industry you will find out that the productivity increase was largely brought on by increased automation and higher machine speeds. I know the article doesn't state that but having been a cost accountant for some 30 years I know that to be the case in most areas. That doesn't mean that I want the poor to be poorer just that investments in fixed assets created a lot of the gain.
That wouldn't surprise me.
 

cbi1972

Hall of Fame
Nov 8, 2005
18,144
1,301
182
51
Birmingham, AL
As you state, this is global data. I presented U.S. data. And even the link you provided contrasts booming socioeconomic mobility in a few select global markets against the far below average mobility seen in the U.S.
I offered the global data as a more satisfying explanation of the US phenomenon than changes in US tax policy. Saez, Piketty, and Stantcheva are ignoring important economic trends. CEO salary negotiation didn't cause this.

The global data shows that the money didn't just go to the US rich, it went to the global poor as well.

I'm not at all sure these graphs say very much about mobility as I understand it. The graphs would look exactly the same if two people traded places, i.e. a poor person became rich while a rich person became poor.
 

92tide

TideFans Legend
May 9, 2000
58,263
45,054
287
54
East Point, Ga, USA
I offered the global data as a more satisfying explanation of the US phenomenon than changes in US tax policy. Saez, Piketty, and Stantcheva are ignoring important economic trends. CEO salary negotiation didn't cause this.

The global data shows that the money didn't just go to the US rich, it went to the global poor as well.

I'm not at all sure these graphs say very much about mobility as I understand it. The graphs would look exactly the same if two people traded places, i.e. a poor person became rich while a rich person became poor.
i wouldn't be so sure of that


cbi1972

Hall of Fame
Nov 8, 2005
18,144
1,301
182
51
Birmingham, AL
i wouldn't be so sure of that
WSJ: First the Volcker Rule, Now the Eddie Murphy Rule

Wall Street Journal (2010) said:
Yes, regulators appear to be turning to 1980s screwball comedies for inspiration for new rules. It’s hard to imagine CFTC chief Gary Gensler keeping a straight face, while telling Congress about this item in his testimony Wednesday:

We have recommended banning using misappropriated government information to trade in the commodity markets. In the movie “Trading Places,” starring Eddie Murphy, the Duke brothers intended to profit from trades in frozen concentrated orange juice futures contracts using an illicitly obtained and not yet public Department of Agriculture orange crop report. Characters played by Eddie Murphy and Dan Aykroyd intercept the misappropriated report and trade on it to profit and ruin the Duke brothers. In real life, using such misappropriated government information actually is not illegal under our statute. To protect our markets, we have recommended what we call the “Eddie Murphy” rule to ban insider trading using nonpublic information misappropriated from a government source.
 

rolltide_21

Hall of Fame
Dec 9, 2007
11,481
7,562
187
NW AL
This phenomenon has little to do with marginal US tax rates. I attribute the characteristics in this graph to the rise of globalism.
We've outsourced a lot of manufacturing, which has diverted opportunities from average Americans to average people in China, India, Malaysia, Mexico, and practically everywhere else. Foreign workers and the investor class have reaped the benefits.


The Story of Globalization in 1 Graph

The US probably represents the top 20% of the global graph. The same spike exists for the "booming global elite" but there is also a giant hump for the relatively low-income people making up the majority of the world.
Great post. I agree. I travel to Asia yearly and I'm seeing the American companies popping up in other Asian countries in addition to the ones you mention. It's blessing a lot of lives/families in those countries. You're exactly right about it helping the global poor.

Also, thanks for sharing the link.


Sent from my iPhone using Tapatalk
 

CharminTide

Hall of Fame
Oct 23, 2005
7,319
2,032
187
I offered the global data as a more satisfying explanation of the US phenomenon than changes in US tax policy. Saez, Piketty, and Stantcheva are ignoring important economic trends. CEO salary negotiation didn't cause this.

The global data shows that the money didn't just go to the US rich, it went to the global poor as well.

I'm not at all sure these graphs say very much about mobility as I understand it. The graphs would look exactly the same if two people traded places, i.e. a poor person became rich while a rich person became poor.
I agree about these graphs not really presenting information on social mobility, I was only using the language in your linked article. And the authors acknowledge that the cause of this growing inequality isn't known with confidence. While I wouldn't be surprised if marginal tax changes played some role, that probably isn't the whole story.

But regardless of the reasons why, it's hard to see those trend lines and just ignore them. Bernie may have been a flawed candidate (in a sea of flawed candidates), but I think this was the most resonant part of his message.
 

cbi1972

Hall of Fame
Nov 8, 2005
18,144
1,301
182
51
Birmingham, AL
I agree about these graphs not really presenting information on social mobility, I was only using the language in your linked article. And the authors acknowledge that the cause of this growing inequality isn't known with confidence. While I wouldn't be surprised if marginal tax changes played some role, that probably isn't the whole story.

But regardless of the reasons why, it's hard to see those trend lines and just ignore them. Bernie may have been a flawed candidate (in a sea of flawed candidates), but I think this was the most resonant part of his message.
I have no doubts that subjective feelings about perceived inequality create dissatisfaction that motivates political activity, but ignoring the root cause will produce ineffectual, if not counterproductive policy.

If I have a mama cat with kittens, and a raccoon that's stealing their food, it does no good to yell at the mama cat for hunting birds and not nursing the kittens.
 

Tide1986

Suspended
Nov 22, 2008
15,670
2
0
Birmingham, AL
The progressive haven of Seattle reaches new heights of income inequality:

https://www.seattletimes.com/seattl...campaign=Top+of+the+Times+11.18.17_11_18_2017

Some records you don’t want to break.

In 2016, Seattle hit an all-time high for a commonly used measure of income inequality, known as the
Gini index. And if you’re worried about Seattle turning into the next San Francisco, this won’t set your mind at ease: Last year marks the first time we’ve matched the City by the Bay for this particular statistic.
 

Tidewater

Hall of Fame
Mar 15, 2003
22,461
13,292
287
Hooterville, Vir.
Not disputing the data above, and acknowledging that income inequality is bad for a republic, I will only add that four of the wealthiest counties in the US are DC suburbs in Virginia.
1 New York County New York
2 Arlington Virginia
3 Falls Church City Virginia
4 Marin California
5 Alexandria City Virginia
6 Pitkin Colorado
7 Los Alamos New Mexico
8 Fairfax County Virginia

That ain't too cool either.
 

Tide1986

Suspended
Nov 22, 2008
15,670
2
0
Birmingham, AL
Another interesting development in Seattle. An income tax on the wealthy has been struck down because it violates the state constitutional requirement that taxes be applied uniformly (I might just like Washington a little more now):

https://www.seattletimes.com/seattl...il&utm_term=0_5beb38b61e-6d5f14b5cc-122421549

King County Superior Court Judge John R. Ruhl agreed with multiple legal challenges that a city ordinance passed in July to impose a new income tax on wealthy earners violates the state’s constitution and has no authority under state law.

By signing the summary judgment order presented by multiple plaintiffs who’ve sued the city over the measure, Ruhl has agreed that with their argument that Washington’s constitution and statutes both prohibit tax plans that impose different rates on low income individuals and those who earn more money.
 
Last edited:

Tide1986

Suspended
Nov 22, 2008
15,670
2
0
Birmingham, AL
Different perspectives are inconvenient I guess.

Nevertheless, with respect to income inequality, states, cities, and local communities are free to create the social-economic environments they desire. It's the beauty of the system when it's allowed to work as designed. The more locally such issues are addressed, the greater the peace and happiness our country will experience. Else, be happy with the extreme divide and the yo-yo impact of changing political winds.
 

Latest threads

TideFans.shop - NEW Stuff!

TideFans.shop - Get YOUR Bama Gear HERE!”></a>
<br />

<!--/ END TideFans.shop & item link \-->
<p style= Purchases made through our TideFans.shop and Amazon.com links may result in a commission being paid to TideFans.